|
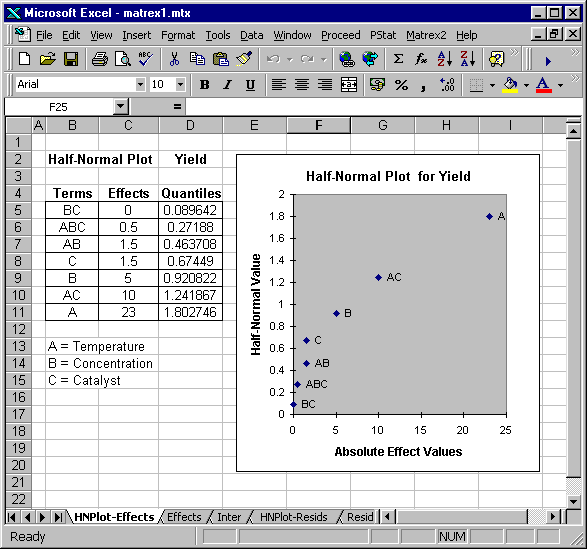
Half-Normal Plots
A
Normal Probability Plot is a
way of plotting data to test whether it is derived from a normal distribution.
It is a graphical technique and is subjective in nature.
Despite this it is one of the most useful techniques available to an
experimenter, since it often clearly indicates the effects which deviate from a
normal distribution, i.e. those which are active.
Normal
plots are also useful for evaluating a regression model: in this case we plot
the model residuals. Calling the normal plot function from within a
Matrex regression worksheet automatically generates a plot of the residuals.
Click here to return to the features page.
|