|
Interactions - a surface plot view
The effect of an interaction can be clearly seen by
plotting the model equation on a 3D surface plot. If we have a model of
the type:
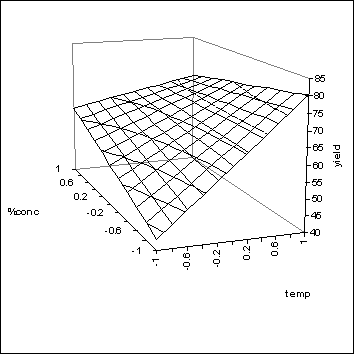
y = K
+ a1C + a2T
-
i.e. no interaction term - then the resulting surface plot would be of the
following form:
Here, y is the yield, C
is the % concentration and T is the temperature. We can see that, as we
increase both C and T, the yield also increases. We can also see that the
increase in the yield for a given increase in T is independent of the value of
C. This gives the parallel straight lines on the surface which describe
yield vs. temperature (T). The practical outcome of this is that we would
be correct to choose the high values of both C and T to obtain the maximum
yield.
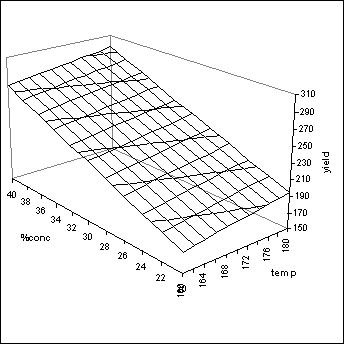
If, however, we have a model
equation of the type:
y = K + a1C + a2T + a3CT
- i.e. there is an interaction
term (CT) - then the surface plot could look completely different, depending on
the size of the interaction. From a practical perspective, the worst case
would be where the interaction is large and negative, which would give a
surface plot of the following form:
Here we can see that the
expected yield has been significantly reduced at the high values of C and
T. If the interaction is large enough then the yield could actually be
pushed lower.
From the above plot we can
see that the optimum operating point is actually where T is high, but C is low.
Detecting the presence of such
an interaction is difficult enough with 2 factors: as the number of factors
increases it becomes impossible without the use of DoE methods.
|